By the end of today you will practice a few quarto/markdown tricks to polish your report and simplify your presentation. Specifically we will discuss:
code chunk settings
citations
kable() tables
quarto presentations
Project logistics
Presentations are a required component of the final project and it’s expected all group members will be there.
The final project is a website.
You can keep or delete the “Proposal” page.
You can add additional pages if you wish, e.g. an “Abstract” page
The Presentation, Report and About pages are required.
You will turn in your slides, report (whole website) by pushing to GitHub
You will additionally turn in your report via Gradescope.
Code chunk settings
Some options available for customizing output (see quarto documenation for more detail).
Option
Description
eval
Evaluate the code chunk (if false, just echos the code into the output)
echo
Include the source code in output
warning
Include warnings in the output
message
Whether to preserve messages emitted by message() (similar to the option warning)
include
Catch all for preventing any output (code or results) from being included (e.g. include: false suppresses all output from the code block)
These options can be applied globally (the whole document) or locally (a specific code chunk). Global settings are controlled in the YAML (see the top of the document) while local code chunk options can be applied with #| (see example below).
In addition to code chunks, figures have settings as well.
We can set captions and an alt attributes using #| fig-cap: and #| fig-alt: respectively. alt captions specify “alternate text” for an image. Alternative text appears if an image cannot be displayed and is also read by screen-readers.
Additional figure options include
Option
Description
fig-width
figure width in inches
fig-height
figure height in inches
fig.align
e.g. fig.align: center centers figure alignment
fig.asp
changes figure height based on aspect ratio with width
out.width
sets figure width relative to text (1000 = 100% text width), e.g. out.width: 1000
In all cases above, we can again set options locally or globally. Note: local options override global options.
Exercise 2
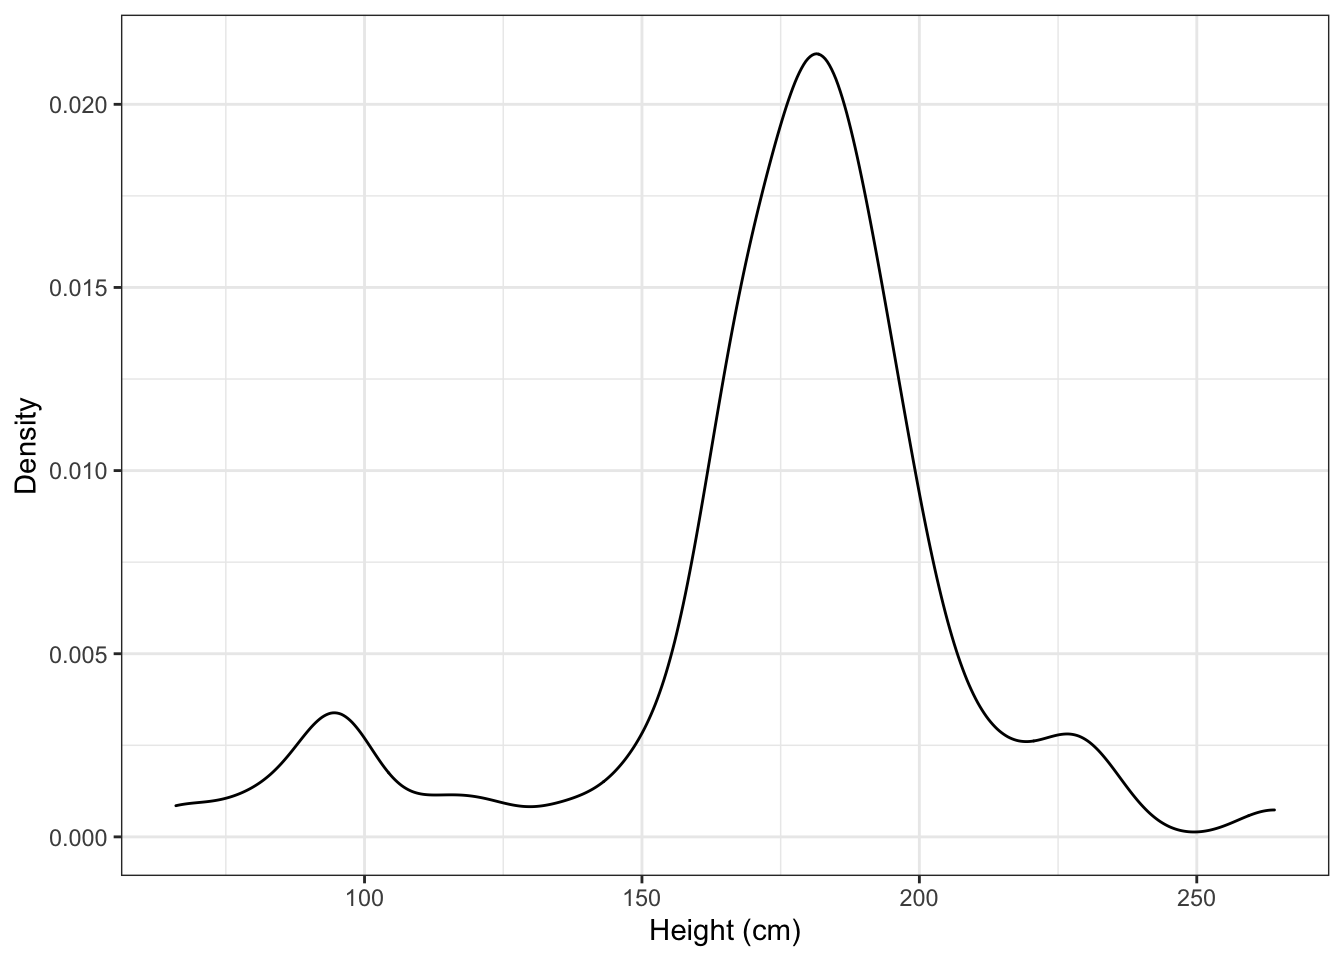
Add a figure caption to the figure below. Next, change the output width to be 50% of the text. Finally, align the figure with the center of the page.
For the project, you will set the option echo: FALSE and warning: FALSE to hide all code and warnings in your final report.
Suggestion: make your figures consistently themed, e.g. use similar figure size/aspect ratio and color scheme throughout your report. Change the default gray background, see themes.
Exercise 3
Change the global code chunk settings so the document is formatted as your final project will be. Render and take a look at the updated PDF.
Citations
Your report will include citations, e.g. the data source, previous research, and other sources as needed. At a minimum, you should have a citation for the data source.
All of your bibliography entries will be stored in a .bib file. The entries of the bibliography are stored using BibTex, i.e., a format to store citations in LaTeX. Let’s take a look at references.bib.
In addition to the .bib file:
Include bibliography: references.bib in the YAML.
At the end of the report, include ## References. This will list all of the references at the end of the document.
Citation examples
In Wickham, Chang, and Wickham (2016), the authors focus present the grammar of graphics package ggplot2 for R.
Calculate the mean, median, and standard deviation of mass. Display the results.
Exercise 5
# code here
Let’s neatly display the results using the kable function from the knitr package. We will
Display results to 2 decimal places
Customize column names
Add a caption
## add code
Presentations (demo)
Wickham, Hadley, Winston Chang, and Maintainer Hadley Wickham. 2016. “Package ‘Ggplot2’.”Create Elegant Data Visualisations Using the Grammar of Graphics. Version 2 (1): 1–189.