library(tidyverse)
library(tidymodels)Ethics in Statistics and Data Science
STA 199
Bulletin
- this
aeis not due for grade. - Project presentations and repo due Monday lab (by pushing to GitHub)
- Extended deadline: project reports now due Wednesday
- Don’t forget about the statistics experience
Getting started
Clone your ae25-username repo from the GitHub organization.
Today
By the end of today you will…
- critically examine graphics, models and results
- discuss data privacy and redundancy
- analyze a real data example of Simpson’s paradox
Load packages
Guidelines for Discussion
- Respect others. Be charitable towards each other. Speak calmly.
Data Representation
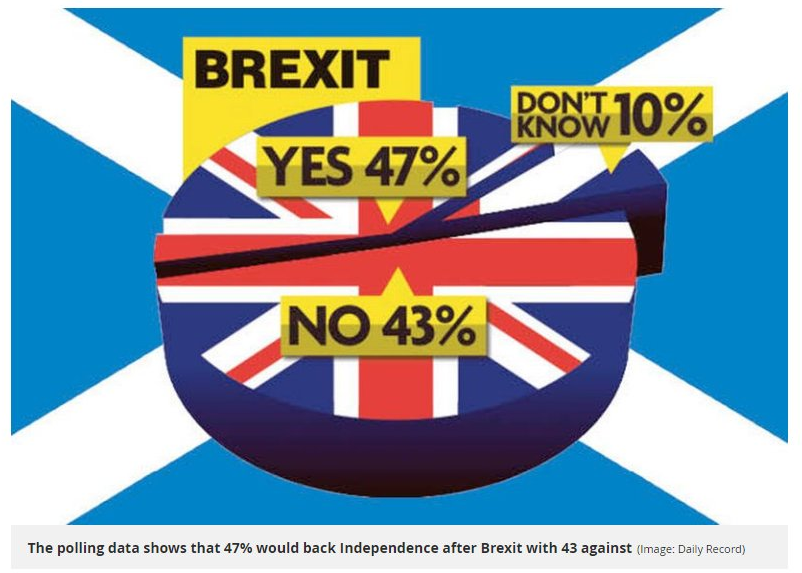
Misleading Data Visualizations1
Brexit

What is the graph trying to show?
Why is this graph misleading?
How can you improve this graph?
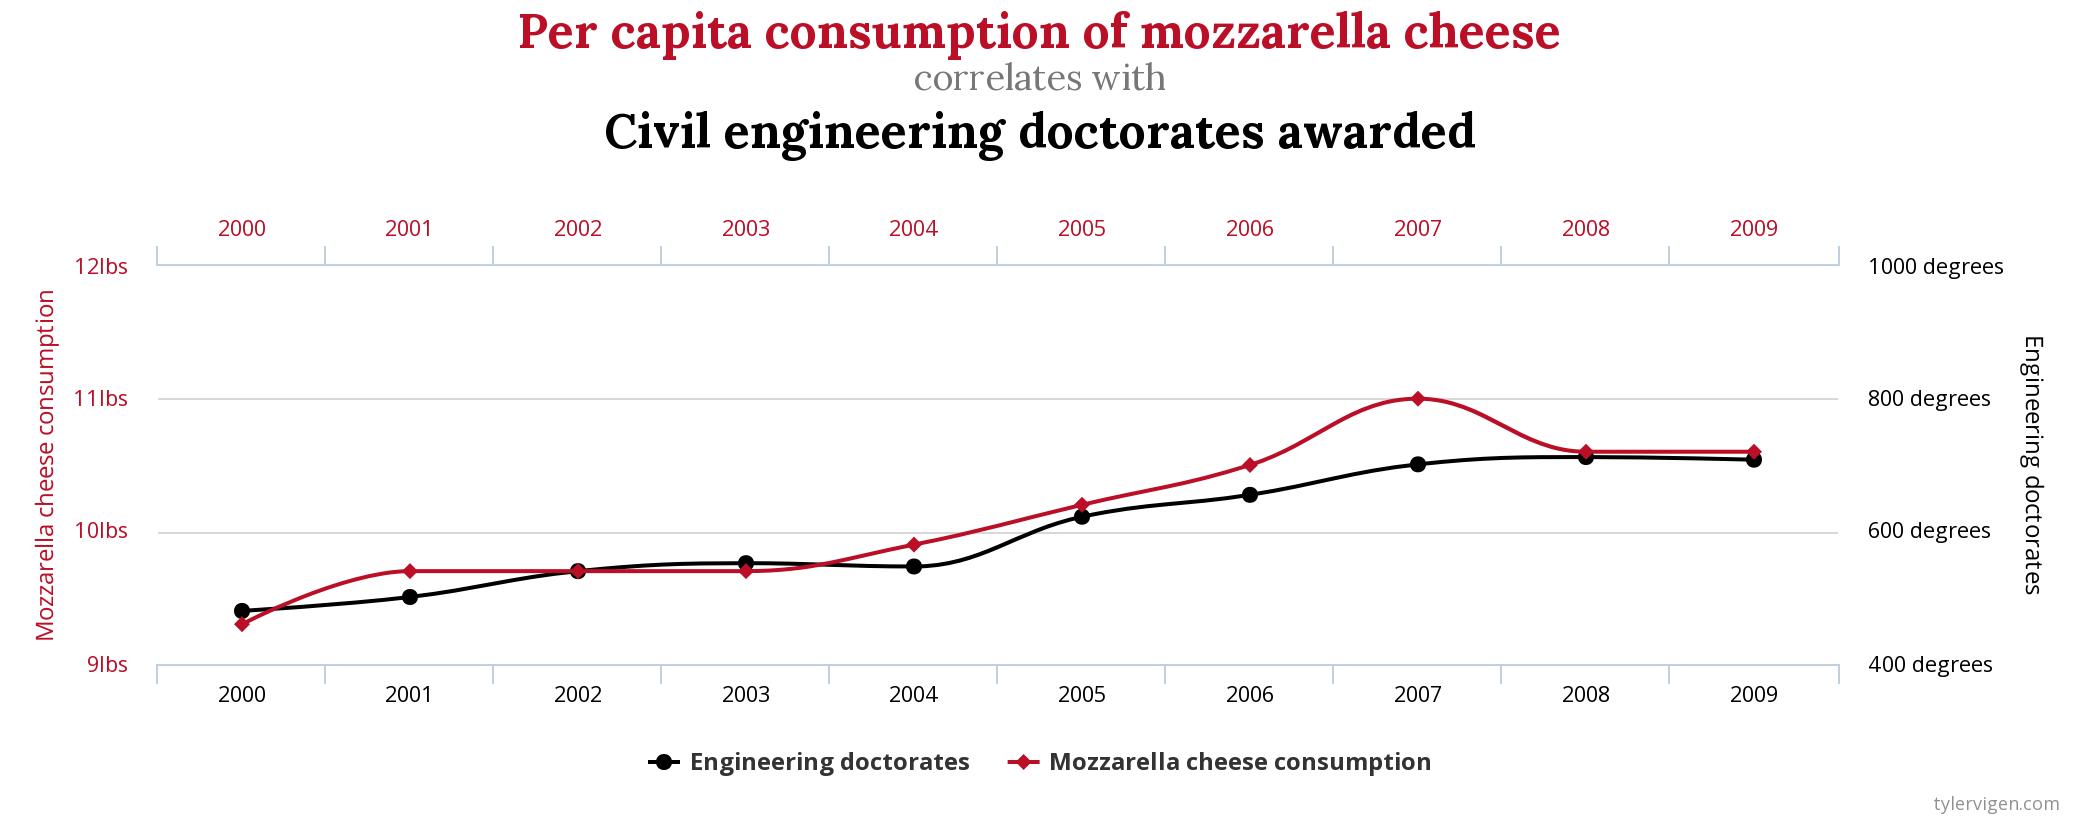
Spurious Correlations2

What is the graph trying to show?
Why is this graph misleading?
Statistical modeling
Read, with a critical eye, page 2 and table 1 from Physician–patient racial concordance and disparities in birthing mortality for newborns and chat with your neighbor.
Data privacy
Web scraping3
A data analyst received permission to post a data set that was scraped from a social media site. The full data set included name, screen name, email address, geographic location, IP (Internet protocol) address, demographic profiles, and preferences for relationships. The analyst removes name and email address from the data set in effort to deidentify it.
Why might it be problematic to post this data set publicly?
How can you store the full dataset in a safe and ethical way?
You want to make the data available so your analysis is transparent and reproducible. How can you modify the full data set to make the data available in an ethical way?
Redundancy
Additional readings
Discussion questions
“Simpson’s paradox”, where conclusions drawn from analyzing subgroups differ from conclusions drawn when the groups are combined. Can you demonstrate Simpson’s Paradox with the data below? 4
berk = read_csv("https://sta101.github.io/static/appex/data/BerkeleyAdmissionsData.csv")Rows: 7 Columns: 5
── Column specification ────────────────────────────────────────────────────────
Delimiter: ","
chr (1): Dept
dbl (4): MaleYes, MaleNo, FemaleYes, FemaleNo
ℹ Use `spec()` to retrieve the full column specification for this data.
ℹ Specify the column types or set `show_col_types = FALSE` to quiet this message.berk# A tibble: 7 × 5
Dept MaleYes MaleNo FemaleYes FemaleNo
<chr> <dbl> <dbl> <dbl> <dbl>
1 A 512 313 89 19
2 B 313 207 17 8
3 C 120 205 202 391
4 D 138 279 131 244
5 E 53 138 94 299
6 F 22 351 24 317
7 All 1158 1493 557 1278Footnotes
Source: https://humansofdata.atlan.com/2019/02/dos-donts-data-visualization↩︎
Source: https://www.tylervigen.com/spurious-correlations Content warning: some examples include death or suicide.↩︎
Modified from Modern Data Science with R, 2nd Edition↩︎
Source: https://www.randomservices.org/random/data/Berkeley.html↩︎